Sensory Analysis
7. Types of tests for recipe optimization
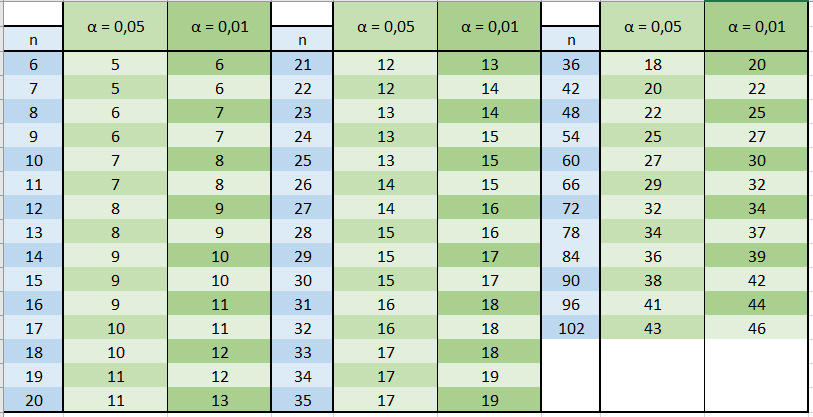
7.3. Sensory Evaluation table
The calculations for each number of participants at different accuracy levels has been published in tables by Roessler et al. in 1978 and has been adapted by Lawless and Heymann in 2010.
n = the number of participants
α = the accuracy level (0,05 => 95% accuracy; 0,01 => 99% accuracy)
The numbers in the table indicate the number of required correct answers to determine that a difference between the sampes exist. If the number of correct answers is \( \leq \) the number indicated in the table, no decernable difference between samples exists with statsically significant accuracy.