Sensory Analysis
| Site: | Plattform für Weiterbildung und Internationalisierung der Hochschule Weihenstephan-Triesdorf |
| Course: | Entrepreneurship in Food |
| Book: | Sensory Analysis |
| Printed by: | Gast |
| Date: | Sunday, 26 July 2026, 4:58 AM |
Description

1. Introduction
Sensory analysis can be used in the product development
stage, for quality control purposes (including storage stability), to measure
consumer satisfaction, or if any changes need to be made to the recipe. This
can be the case if the product needs to be improved, if the process changes,
or the production cost needs to be reduced.
In the following chapters we will look at the procedures and methods of sensory analysis.
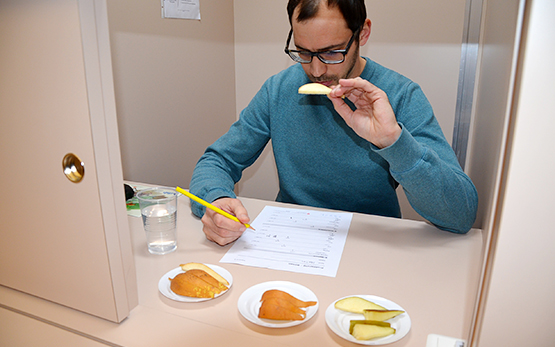
2. The Examiner
Sensory analysis or tasting can be carried out by a panel of laymen, e.g. typical consumers of the product, with or without prior experience.
It can also be carried out by trained examiners e.g. laboratory personel, who have a high sensory sensivity and are trained to do tasting.
A third group of food tester can be an appraiser, a person who has received training in sensory analysis but has also expert knowledge about the product.
All examiners should have:
- A neutral attitude towards the product to be tested
- Linguistic competence
- No allergies or intolerances to test product
- Good senses (no olfactory, gustatory disorders, etc.)
3. Sample Preparation
For successful sensory testing, sample selection, preparation, neutralization, coding and presentation are critical to provide an objective evaluation.
- Sample selection
The differences between the samples should be as small as possible, i.e. all testers should receive the same samples as far as possible. Ensure all samples are available in sufficient quantities to allow multiple tastings. - Sample preparation
Samples must all be at the same temperature, unprepared samples are tasted at room temperature (except e.g. ice cream). Hot samples are heated shortly before tasting. Serving sizes, and presentation should be as similar as possible. Pay extra attention to samples that depend on solubility and mixing of ingredients. - Sample neutralization
The sample name or brand should be not identifiable. Therefore, the sample must be transferred to a neutral container. All containers must be identical. - Sample coding
The samples are neutrally coded before testing to make them anonymous. Samples should be presented in a randomized order and vary in repeated sessions. - Sample presentation
The samples are presented in neutral vessels, in terms of smell, taste, and color. Also crockery used in tasting nmeeds to be taste- and odorless.
A tasting series should not consist of too many samples to avoid the risk of fatigue, wherby an examiner is no longer able to perceive sensory stimuli adequately.
4. Do's and Don'ts
To prepare for panel tasting it is important to formulate clear questions beforehand, which are not ambiguious or ask for information that the examiner cannot give, because she/he is not familiar with certain terms or concepts.
- Provide a clear description of the task and explain the tasting process beforehand.
- During the tasting always ask questions about appearance and smell first, as these are the first impressions that are perceived.
- Always provide more than only 2 or 3 possible answers to JAR or popularity tests.
- Avoid colloquial language, like "I don't know" or "I guess". It is better to use terms like: "Neutral" or "Rather less".
- Be aware that you cannot expect sensory expertise from untrained consumer-panel members. Therefore, avoid technical insider jargon.
- Do not ask questions that require long, detailed answers, but instead ask more questions that can be checked quickly.

5. Thresholds
1. Threshold
Lowest concentration or intensity at which a change compared to another sample is perceived, which means: the type of change is not yet recognized, only a difference has been noticed.
2. Detection Threshold
Lowest concentration or intensity at which a characteristic or substance can be identified (e.g. sweet).
3. Difference Threshold
Lowest concentration or intensity that is necessary to perceive a difference between two stimuli.
4. Saturation Threshold
Concentration or intensity, above which a further increase does not produce a stronger impression. This is reached as soon as all receptors are occupied.
6. Types of sensory tests
We can differengtiate different types of sensory tests depending on the information we require.
1. Analytical sensory testing
Requires trained examiners and is usually carried out with small panels (6-14 examiners)
This type of testing is used to evaluate specific characteristics of a product e.g. during prodcut development or process changes or for purposes of quality control.
2. Hedonic sensory testing
This type of testing evaluates the subjective perception of product characteristics and is usually done with large panels (more than 60 examiners) who do not need to fullfil any partiqular requirements, which means they can be selevted from the consumer group.
This type of testing can be used during product
development, market research, or to study consumer behavior/preferences.
7. Types of tests for recipe optimization
difference test
Tests if a change made to the product results in a perceived difference.
e.g., triangle test, pairwise difference test
intensity test
Tests wether a change lead to a certain
feature being perceived more or less intensively
(1-5 point scale)
popularity test
Tests wether a change improves or worsenes the taste of the product
(like/dislike scale 1-9)
JAR test (Just About Right)
Tests the perception of a specific attribute of a product
(too high, too low, or just about right)
7.1. Example: Triangle test
Triangle testing tests for the perceived difference between two slightly different products.
The panel should consist of a minimum of 5 examiners or more if untrained examiners are used.
Preparation:
The examiner is presented with 3 samples of
which 2 are identical and one is different. They must be presented in identical
containers and there must be no visual difference between the samples (color,
filling, etc.). Samples must have the same temperature. Sample must be
identified with randomized three digit numbers.
The examiner is given written instructions and is requested to find the deviating sample. The examiner is also instructed to make a guess in case no difference can be definitely determined. In that case the examiner has to leave a remark that the decision was the result of a guess.
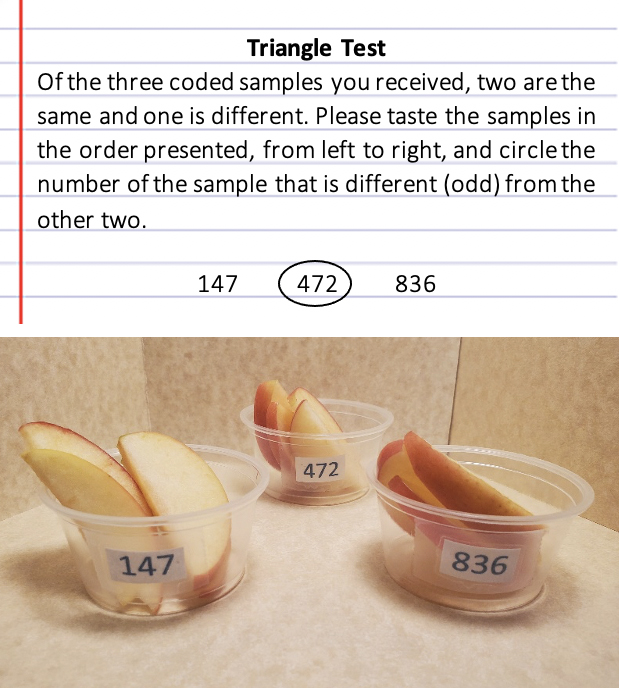
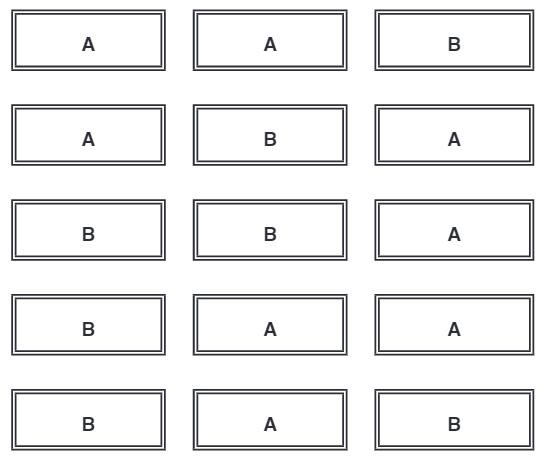
The test can be repeated several times with different, randomized set ups (order in which the samples are presented) for higher statistical accuracy of the result. Optionally, the order in which the examiner has to taste the samples can be prescribed. However, re-tasting of the samples against each other is usually permitted.
Possible rehearsal setups
7.2. Statistical Evaluation of triangle tests
There are two possible outcomes for each tested triangle:
- NO, the examiner did not find a difference between the samples and had to make a guess. This is called the hypothesis of "no difference" or null hypothesis (H0)
- YES, the examiner detected the difference and was able to correctly identify the sample. This is the opposite of the null hypothesis, also called the alternative hypothesis (H1)
As there are 3 samples in each triangle, of which 1 is indeed different, the chance that the examiner guesses the correct sample by sheer luck is 1 out of 3 (1/3).
From this follows that the number of expected correct guesses (Ec) made by all examiners is:
The number of examiners (n) multiplied by the
probability of lucky guesses (1/3) => Ec = n*(1/3)
Example: the
panel consists of 42 examiners => n = 42
Ec = n*(1/3) => Ec = n/3 => Ec = 42*(1/3) => Ec = 14
That means, if 42 examiners identify the correct
sample 14 times, this could be 100% lucky guesses.
This needs to be compared against the number of actually given (observed) correct answers (Oc), and we need to determine the probability (p) of the correctly selected samples not being identified because of their actual difference but by sheer chance. Obviously, to be sure that the difference was indeed correctly identified, the probability of this error should be small. We can set the level of accuracy at which we want to accept the results as significant (= significance level α), ourself. Or in other words, we can decide how sure of the result we need to be to be able to reject the null hypothesis H0. The conventionally accepted accuracy is usually 95% or even 99%.
The significance level is calculated as follows:
x% = (1-α)*100
Which means:
0% accuracy translates to α = 1
95% accuracy translates to α = 0,05
99% accuracy translates to α = 0,01
100% accuracy translates to α = 0
=> The smaller the value of α, the higher the accuracy level against which we
compare our result.To calculate the probability (p) we
use the binomial distribution formula: 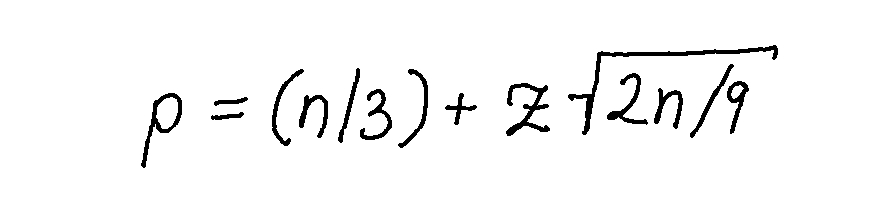
whereby z stands for the z-score (Standard Deviation). These are fixed values for each accuracy level:
at α = 0,01 the corresponding z = 2,33
at α = 0,05 the corresponding z = 1,64
Example:
\( p=(42/3)+2,33 \sqrt[]{2*42/9} \)
=> p = 21,12
This value is rounded up to the next whole number, in this case 22. Which means, the examiners have to perceive a difference at least 22 times to determine with an accuracy level of 0,01 (99% likelyhood) that the products have indeed a decernable difference.
So, if the observed number of correct answers (Oc) is larger than the probability of a correct answer (p) we can reject the null hyposethis that the products have no difference.
=> Oc \( \geq p \neq H0 \)
Or else, if the observed number of correct answers (Oc) is smaller than the probability of a correct answer (p) we can determine that the null hypothesis is true, and that there is no decernable difference between the two products.
=> Oc \( \leq p = H0 \)
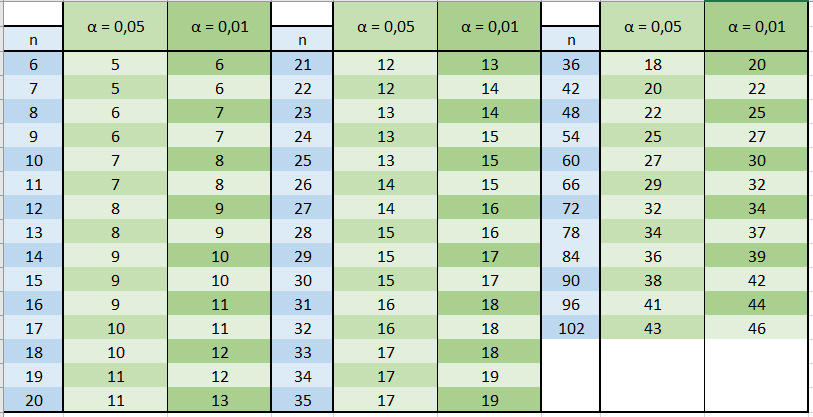
7.3. Sensory Evaluation table
The calculations for each number of participants at different accuracy levels has been published in tables by Roessler et al. in 1978 and has been adapted by Lawless and Heymann in 2010.
n = the number of participants
α = the accuracy level (0,05 => 95% accuracy; 0,01 => 99% accuracy)
The numbers in the table indicate the number of required correct answers to determine that a difference between the sampes exist. If the number of correct answers is \( \leq \) the number indicated in the table, no decernable difference between samples exists with statsically significant accuracy.
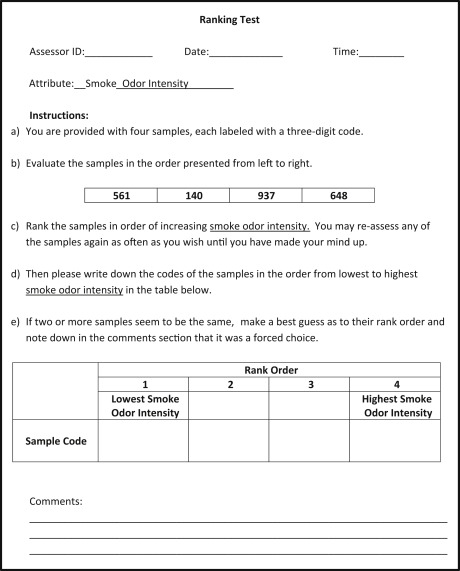
7.4. Ranking Check
The ranking check tests how a number of products relate to one another in regard to a particular attribute. This test can be used to determine of the influence of:
- different raw materials
- different treatment methods
- different packing and storage methods
Advantage: More than 2 products can be compared with each other
Disadvantage: If the differences are only small the results can be varied and unclear. In that case additional triangle tests can can be conducted to narrow down the results.
Preparation:
Several samples are placed next to each other and the examiners are requested to rank them according to the intensity of an attribute, e.g. saltiness, sweetness, etc.
The samples are then ordered from weakest to strongest intensity of that attribute.
7.5. Statistical Evaluation of a ranking check
To determine the overall ranking of a sample simply all rankings are summed up and then the samples are ranked in the order of the smallest to the largest sum
The table shows the ranking each examiner gave each sample. The total ranking is determined by adding all ranks per sample.
|
Rank Sum Calculation |
|
|
|
|
|
|
|
Sample 830 |
Sample 713 |
Sample 924 |
Sample 412 |
Sample 335 |
|
examiner 1 |
1 |
2 |
3 |
5 |
4 |
|
examiner 2 |
2 |
1 |
4 |
3 |
5 |
|
examiner 3 |
2 |
3 |
1 |
4 |
5 |
|
examiner 4 |
1 |
2 |
3 |
5 |
4 |
|
examiner 5 |
1 |
2 |
4 |
5 |
4 |
|
examiner 6 |
2 |
1 |
5 |
4 |
3 |
|
rank sum |
9 |
11 |
20 |
26 |
25 |
|
Overall rank |
1 |
2 |
3 |
5 |
4 |
|
|
|
|
|
|
|
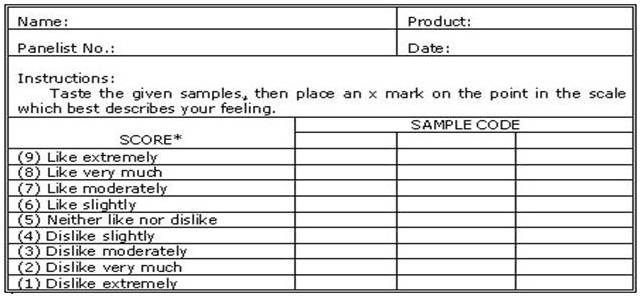
7.6. Example: Popularity Test
7.7. JAR (Just About Right)
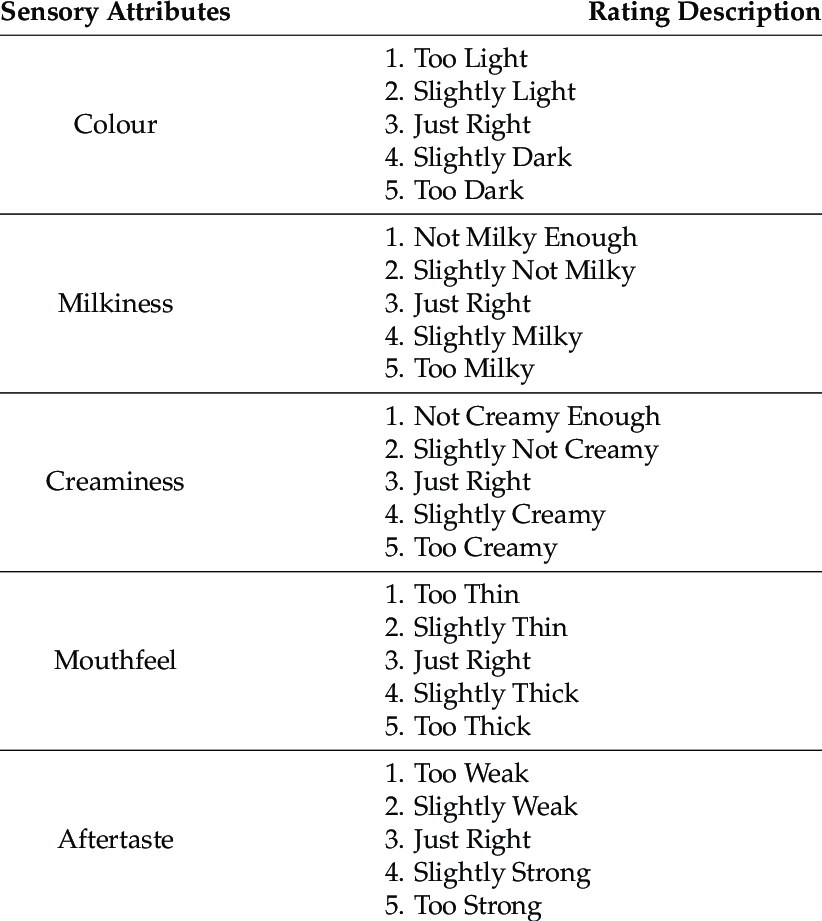
The JAR method is used to test the intensity or exptression of a certain attribute of a product, e.g. saltyness, or sweetness. If several attributes are classified through the JAR method they can be linked to the overall popularity of a product.
An attribute can thereby be either too strong, strong, just about right, weak or too weak. Rating is done accordingly on a 1 - 5 scale.