
Sensory Analysis

7. Types of tests for recipe optimization
7.2. Statistical Evaluation of triangle tests
There are two possible outcomes for each tested triangle:
- NO, the examiner did not find a difference between the samples and had to make a guess. This is called the hypothesis of "no difference" or null hypothesis (H0)
- YES, the examiner detected the difference and was able to correctly identify the sample. This is the opposite of the null hypothesis, also called the alternative hypothesis (H1)
As there are 3 samples in each triangle, of which 1 is indeed different, the chance that the examiner guesses the correct sample by sheer luck is 1 out of 3 (1/3).
From this follows that the number of expected correct guesses (Ec) made by all examiners is:
The number of examiners (n) multiplied by the
probability of lucky guesses (1/3) => Ec = n*(1/3)
Example: the
panel consists of 42 examiners => n = 42
Ec = n*(1/3) => Ec = n/3 => Ec = 42*(1/3) => Ec = 14
That means, if 42 examiners identify the correct
sample 14 times, this could be 100% lucky guesses.
This needs to be compared against the number of actually given (observed) correct answers (Oc), and we need to determine the probability (p) of the correctly selected samples not being identified because of their actual difference but by sheer chance. Obviously, to be sure that the difference was indeed correctly identified, the probability of this error should be small. We can set the level of accuracy at which we want to accept the results as significant (= significance level α), ourself. Or in other words, we can decide how sure of the result we need to be to be able to reject the null hypothesis H0. The conventionally accepted accuracy is usually 95% or even 99%.
The significance level is calculated as follows:
x% = (1-α)*100
Which means:
0% accuracy translates to α = 1
95% accuracy translates to α = 0,05
99% accuracy translates to α = 0,01
100% accuracy translates to α = 0
=> The smaller the value of α, the higher the accuracy level against which we
compare our result.To calculate the probability (p) we
use the binomial distribution formula: 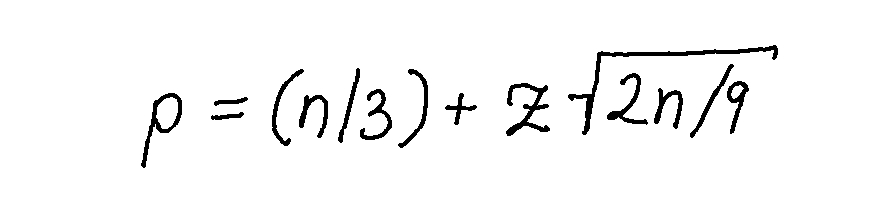
whereby z stands for the z-score (Standard Deviation). These are fixed values for each accuracy level:
at α = 0,01 the corresponding z = 2,33
at α = 0,05 the corresponding z = 1,64
Example:
\( p=(42/3)+2,33 \sqrt[]{2*42/9} \)
=> p = 21,12
This value is rounded up to the next whole number, in this case 22. Which means, the examiners have to perceive a difference at least 22 times to determine with an accuracy level of 0,01 (99% likelyhood) that the products have indeed a decernable difference.
So, if the observed number of correct answers (Oc) is larger than the probability of a correct answer (p) we can reject the null hyposethis that the products have no difference.
=> Oc \( \geq p \neq H0 \)
Or else, if the observed number of correct answers (Oc) is smaller than the probability of a correct answer (p) we can determine that the null hypothesis is true, and that there is no decernable difference between the two products.
=> Oc \( \leq p = H0 \)